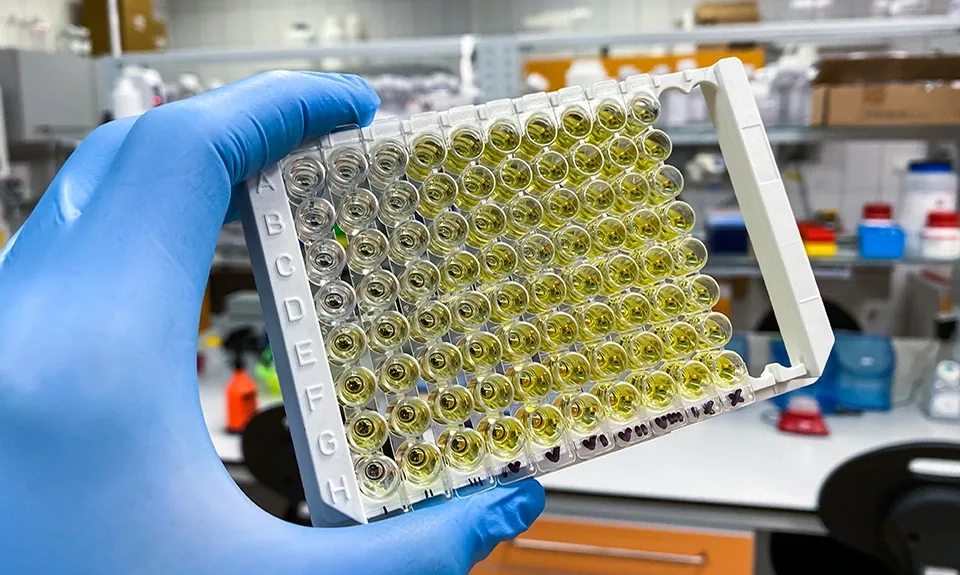
This study protocol is suggested as an objective method to qualify that the Cygnus Technologies Host Cell Protein (HCP) ELISA kits and other bioprocess impurity kits will yield accurate, specific and reproducible results for a given product and sample type. In addition to the ELISA validation protocol detailed below, it is necessary to utilize orthogonal methods to determine coverage and to assure all significant HCPs are being detected. Despite its many acknowledged limitations, Western blot, both one- and two-dimensional, have historically been used to characterize reactivity of polyclonal antibodies to individual HCPs and for use in early development of downstream purification processes. Unfortunately, the analysis of anti-HCP antibodies by Western blot is of very limited predictive value due to the lack sensitivity and specificity in detecting HCP in final product and other downstream samples. It is for this reason, ELISA is proven to be the method of choice for determination of total HCP in downstream samples. To better answer the question of antibody reactivity/coverage to individual downstream HCPs, we recommend a method termed Antibody Affinity Extraction or AAE. For a more detailed discussion of the limitations of Western blot and the advantages of AAE please refer to the technical white paper found on our web site.
ELISA Qualification:
In some cases, your product itself or certain components in product formulation buffer may interfere (either positive or negative interference) in the ability of the assay to detect HCPs or other impurities. Similarly, samples from upstream in the purification process may also contain material in their matrices that can interfere in ELISA methods. Factors such as extremes in pH, detergents, organic solvents, high protein concentration, and high buffer salt concentrations are known interference components. For these reasons, it is necessary to qualify by universally recognized experimental procedures (i.e. ICH & FDA guidelines) that the assay will yield accurate results. Should the end user of this kit determine that there is significant product or matrix interference it may be necessary to further process the sample by methods such as sample dilution or buffer exchange to render it into a more assay compatible buffer. The same diluent used to prepare the kit standards is ideally the preferred material for dilution or buffer exchange of your samples. Please refer to the kit product insert for recommended diluents. In other cases, modification of the assay protocol can effectively improve accuracy in some sample types. Users of our kits are encouraged to contact our Technical Services Department for advice on how best to solve sample accuracy issues. The methods suggested below are intended as a general guidance for the most important parameters of accuracy, specificity and precision. We suggest you review ICH and other similar regulatory guidance for detailed protocols on how to qualify analytical methods.
1. Dilution linearity/parallelism experiments – All sample types to be tested that contain levels of impurity greater than the LOQ of the assay, should initially be evaluated for dilution linearity as part of assay validation. This experiment involves performing a series of doubling dilutions using an approved assay sample diluent. These dilutions are then assayed and a dilution corrected impurity concentration is determined at each dilution. This dilution linearity study establishes freedom of sample matrix interference as well as the important condition of antibody excess in the ELISA for the array of impurities in your samples. If you will be routinely testing in-process samples in addition to final product, you should validate dilution linearity of each sample type. This analysis is particularly critical for HCP assays because very high concentrations of certain individual HCPs may approach saturation of the antibody against that particular HCP. When this happens, there is a risk of under-quantitation for that HCP. By performing dilution analysis, one can verify if the antibody is in excess and that the sample matrix itself does not interfere. If the antibody is in a limiting concentration or the sample matrix causes a negative interference, what will be observed is that the apparent HCP concentration for a sample increases with increasing dilution. In most cases a dilution will be reached where the dilution corrected value remains essentially constant. This dilution is what we term the Minimum Required Dilution or MRD. Table 1 below shows example data where an in-process sample did not yield good dilution linearity at high concentration, but with further dilution, an MRD was determined at which acceptable dilution linearity was obtained. In this example we conclude that the MRD for this in-process sample is 1:8 and that the concentration of HCP to be reported is 361ng/m. Once an MRD is established for a particular sample type, your SOP should reflect that such sample needs to be diluted before assay. We suggest defining acceptable dilution linearity as “dilution corrected analyte concentrations that vary no more than 80% to 120% between doubling dilutions”. Due to the statistical limitations in the low end of the assay range you should avoid consideration of dilution data where the assay value before dilution correction falls below two times the LOQ of the assay. Acceptable diluents may vary from assay to assay and you are encouraged to verify with Cygnus that your sample diluent is acceptable. In general, the best diluent is the same one used to prepare the kit standards. See your kit product insert for recommended diluents. Assay specific diluents can be purchased from Cygnus in 100ml, 500ml or 1000mL bottles. Contact Cygnus for information on acceptable diluents.
Table 1: Example Dilution Linearity Data for an In-Process sample
Sample Dilution
|
Dilution Corrected Value (ng/mL)
|
% change in concentration from previous dilution
|
Neat (undiluted)
|
146
|
NA
|
1:2
|
233
|
160%
|
1:4
|
312
|
134%
|
1:8
|
361
|
116%
|
1:16
|
356
|
99%
|
1:32
|
370
|
104%
|
1:64
|
Not calculated (<2 times LOQ)
|
NA
|
2. Spike and recovery experiments - For each sample type to be tested, be it final product or in-process samples, you should demonstrate that the assay can recover added HCP or other impurity spiked into that sample matrix. This can be simply performed by spiking some of the highest standard provided with the kit into your sample types and then testing in the assay. Spiking studies are only relevant at or below the MRD as established in Section 1 above. Using our E. coli HCP kit, F410 as an example, we suggest spiking 1 part of the 100ng/mL standard into 4 parts of your sample (e.g. spike 100mL of 100ng/mL standard into 400mL of sample). The spiked concentration into the sample in this case is 20ng/mL. A control dilution of 1 part of assay diluent (zero standard) to 4 parts of sample is also performed to determine the contribution of endogenous HCP in the sample prior to spiking. Both the spiked and diluted unspiked samples are assayed. Percent total recovery is determined by dividing the total HCP measured (from endogenous and spike) by the sum of the spike level + the endogenous contribution of HCP. We suggest acceptable recovery should be within 80% to 120% of the spiked HCP. Table 2 shows example data. If you desire spike and recovery at more than one concentration we recommend that the lowest spike levels should be at least 2 times the Limit of Quantitation (LOQ) of the assay and that the contribution of the endogenous HCP in the sample prior to spiking not exceed two times the spike level to be tested. These two conditions will insure better statistical accuracy.
Table 2: Example Spike and Recovery Data
Sample
|
Spike Conc.(ng/mL)
|
Total HCP measured(ng/mL)
|
% Spike Recovery
|
4 parts final product + 1 part zero standard
|
0
|
22
|
NA
|
4 parts final product+ 1 part 250ng/mL std.
|
50
|
70
|
97.2% [70/(50+22)]
|
3. Precision Experiments - We also recommend that each laboratory and perhaps each technician perform a precision study to demonstrate that they can achieve acceptable precision both within and between runs. Such precision would be best accomplished on controls prepared in your laboratory. Those controls should be made in your product matrix and from HCP derived from your cell line and process. Once prepared at the desired levels these controls can be aliquoted and stored frozen to insure stability. Once statistical values have been established on your controls, you will then have an important QC tool to assure that the accuracy is acceptable from kit to kit and assay run to assay run. Beyond the above critical validation studies, you may want to perform other experiments that statistically establish the LOQ and LOD in your laboratories, robustness, stability, etc. as listed in FDA and ICH guidelines. However, you may want to consider using our in-house generic validation study for this less critical data rather than perform it yourself since we view such non-critical data as inherent in the method and not something each laboratory needs to do.
Orthogonal Methods
We find no predictive value in 2D WB of upstream samples as it is too insensitive and non-specific to determine how an antibody when used in an ELISA will quantitatively reactive to the more limited array of downstream HCPs. Instead, we recommend performing AAE on at least 2 samples. The first sample can be very upstream such as harvest material. AAE will provide a more sensitive and accurate assessment of percent coverage than can be achieved by 2D WB. The second sample will come from downstream in your purification process determined by the level of total HCP as measured by ELISA. AAE on this sample will allow you to identify those individual HCPs to which the antibody is reactive. Any individual HCPs spots showing up in a 2D PAGE silver stain or similar method that do not have a corresponding AAE spots can be picked from the 2D PAGE and subjected to Mass Spec analysis to confirm if they are in fact HCPs and if so what is their structure and biological function. Any sample for which dilution linearity cannot be obtained should also be analyzed by Mass Spectrometry to identify major impurities for which there is lack of antibody excess.